Data Integrity
When a Thunderstorm
Sits Over the Station
Every few weeks a Schumann Resonance chart turns into a wall of white and the screenshot travels with an alarming caption. Here is why a reading like that is physically impossible as a global event, and what we do about it.
Is the Schumann reading distorted right now?
The current Schumann reading is not distorted: it passed the interference check, so the value shown is a live measurement.
Every hourly reading is checked for the signature of a storm at the station. When one is found, the reading is held rather than published, and this block says so.
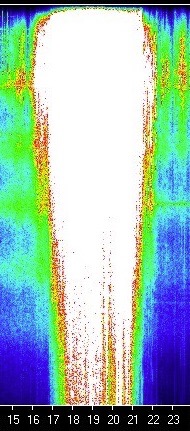
A real washout at the Tomsk station. Time runs left to right, frequency bottom to top.
What you are looking at
The white is the storm, not the planet
The readings come from one physical antenna at one station in Siberia. When a thunderstorm passes directly over that station, lightning striking a few kilometres away completely floods the sensor. Rain static and wind moving the coils add their own noise. The spectrogram whites out from top to bottom, and the horizontal resonance bands vanish inside it. That is a washout.
Read as amplitude, those hours look enormous. In the example above, our pixel pipeline would have read the peak hour as 98 out of 100, a level we see perhaps once in several years. It was a thunderstorm in Tomsk.
If you have seen this shared as a "massive global spike", a "blackout", or a sign that something happened to Earth, this is what it actually was. Sharing it is the right instinct pointed at a bad image.
The Physics
Why a whiteout cannot be a global event
Schumann resonances are standing waves in the cavity between Earth's surface and the ionosphere, excited by the sum of all lightning worldwide. Satellite observations put that at 44 plus or minus 5 flashes per second across roughly 2,000 active thunderstorms at any moment (Christian et al., 2003). Because the cavity is a resonator, that energy does not spread evenly. It concentrates in discrete modes near 7.83, 14.3, 20.8, 27.3 and 33.8 Hz, which is what the horizontal bands on the spectrogram are.
Together those bands occupy roughly a third of the 0 to 40 Hz axis. This is the hard constraint: even the most extreme genuine event raises amplitude inside those bands. A global geophysical process that continuously saturates the entire 0 to 40 Hz range does not exist, because it would contradict the resonant structure that creates the signal in the first place.
A nearby strike behaves completely differently. Received power in this band falls off so steeply with distance that a single close flash swamps the globally integrated signal by orders of magnitude, and it arrives as a raw broadband impulse, flat across the whole range, because the sensor is picking up the direct pulse rather than the round the world, cavity filtered resonance. Same lightning, opposite signature, purely because of where it happened.
The one thing that cannot overlap
Vertical extent of saturation in a single time slice
Real resonance, even extreme
Band limited, up to about a third of the chart height
Brighter horizontal bands
Storm at the station
Broadband, 40 to 100% of the chart height
Full height white pillars
The two signatures do not meet. That gap is a physics boundary rather than a tuned guess, which is what makes the check reliable enough to act on automatically.
Method
How the interference check works
Runs on every hourly reading, before the Activity Index is calculated and before any alert is sent.
Detect
The hour is split into 20 columns of about three minutes each. A column counts as contaminated when at least 40% of its full height is saturated, which sits above the ceiling real band limited activity can reach. Three such columns, roughly nine minutes of sustained saturation, trigger a hold. A single stray strike does not.
Hold
A saturated sensor was pegged at maximum, so the hour contains no recoverable resonance information and any corrected number would be invented. Instead the last measurably clean Schumann value is carried forward, confidence drops to 40, and Kp and solar stay live so a genuine geomagnetic storm still surfaces.
Disclose
The contaminated sensor value is preserved and published alongside the held one, the hour is marked in the charts, and the public JSON feed carries the flag so anyone republishing our data inherits the disclosure. Station weather is logged as corroboration, never as the trigger.
Can this check hide a real event?
It is the first thing we tested, because a filter that suppresses genuine activity would be worse than no filter at all. Across 56 hours of confirmed Kp 6 to 8 geomagnetic storms in our history, the saturation measure never exceeded 0.164, nowhere near the 0.4 threshold. Genuine activity is band limited, so it cannot reach the level the check looks for. On top of that, the Kp and solar components of the Activity Index keep updating during a hold, so even a wrongly held hour cannot conceal a geomagnetic storm.
The threshold itself was derived from 1,744 hourly segments backtested over May to July 2026. Hours with rain at the station clustered around a saturation measure of 0.44 at the 90th percentile against 0.055 for dry hours, and all 20 known contamination episodes in that window landed at 0.40 or above.
Frequency
How often does this actually happen?
Counted live from our own production readings over the last 90 days, not quoted from a number that quietly goes stale.
123
Hours held
out of 2,162 hourly readings
5.7%
Of all readings
the rest were published as measured
40
Days affected
storms usually span several consecutive hours
Sep 21, 4:00 AM UTC
Most recent hold
the last time a storm sat over the station
Contamination is uncommon but not rare, and it clusters: Tomsk has a thunderstorm season, so a handful of stormy days produce most of the held hours. That clustering is also why the viral screenshots arrive in waves.
The Captions
What a washout gets called online
None of these are meant dishonestly. They are what an unlabelled image invites you to think, and the image really does look dramatic.
Often called
A timeline jump or a planetary shift
The chart records voltage in an antenna. A saturated column means the instrument was overwhelmed by a nearby energy source, which in this case was rain and lightning a few kilometres away.
Often called
Earth's frequency spiked or is rising
The resonance frequencies are fixed by the size of the planet and the height of the ionosphere. They do not rise. What moves on the chart is amplitude, which is signal power, and during a washout it is the storm's power rather than the cavity's.
Often called
A blackout or a blank in the data
The opposite: the sensor received far too much signal, not too little. Nothing was switched off and nothing was censored.
Often called
A global energy surge you should prepare for
A genuine planet wide event shows up in the narrow resonance bands, at stations on other continents, and typically alongside a raised Kp index. A single white chart from one station meets none of those tests.
One note to close this section. However you feel on a washout day is real and it deserves attention. What those particular hours cannot do is explain it, because the antenna spent them measuring a thunderstorm in Siberia, so there is no Earth resonance signal in that reading to respond to. Sleep, stress, your own local weather and plenty of ordinary human things are the better places to look first.
Limits
Where this method stops
Stated plainly, because a data integrity page that only lists strengths is not one.
One station
The gold standard check is whether a second station on another continent sees the same rise. A local storm can never hit both, a global event always does. We monitor a single station today, so the check rests on the shape of the signal rather than on a second opinion. Adding a second station is the strongest available upgrade and it is not live yet.
A deliberate grey zone
Storms fray at their edges, and those frayed hours can saturate somewhere between a third and 40% of the chart height, which is also where an unusually strong real event could sit. We let that band through rather than suppress it. Suppressing a genuine event is the worse error, so the known cost is that a storm's leading and trailing hours can read mildly high.
It catches storms at the station, not all local weather
The check is built for lightning close enough to swamp the sensor. Weather further out can still nudge a reading without producing the whiteout signature, and nothing here claims otherwise.
We read a rendered image
Our pipeline analyses the published spectrogram image rather than raw instrument data, so amplitudes pass through the station's colour rendering. Everything is calibrated consistently against that same pipeline, but a change in how the station renders its charts would require recalibration.
It has been wrong once, and we retuned it
On 18 July 2026 a striped, gusty storm frayed just below the original threshold and slipped through. Inflated readings between 81 and 90 were published for several hours and a high activity alert went out to a small number of people before we caught it. We lowered the threshold, replayed 48 hours of live data to confirm the fix caught every affected hour without flagging a single clean one, and kept the raw values so the episode stays auditable.
Sources
Scientific References
Removing local lightning from a Schumann record is established practice in the peer reviewed literature, not something we invented.
Christian, H.J. et al. (2003). Global frequency and distribution of lightning as observed from space by the Optical Transient Detector. Journal of Geophysical Research: Atmospheres, 108(D1), 4005.
Five years of satellite observation putting the global rate at 44 plus or minus 5 flashes per second, correcting the widely repeated figure of 100 per second that came from a 1925 estimate based on thunder day records.
Price, C. (2016). ELF Electromagnetic Waves from Lightning: The Schumann Resonances. Atmosphere, 7(9), 116.
Review of how global lightning excites the Earth ionosphere cavity and why the energy concentrates in discrete modes rather than spreading across the band.
Tatsis, G. et al. (2021). Correlation of local lightning activity with extra low frequency detector for Schumann Resonance measurements. Science of the Total Environment, 787, 147671.
Compares an ELF detector against a precision lightning network and finds a statistically significant correlation between local strikes and the recorded signal, concluding that local lightning has to be removed from the background before Schumann parameters are estimated.
Mushtak, V.C. & Williams, E.R. (2009). An improved Lorentzian technique for evaluating resonance characteristics of the Earth-ionosphere cavity. Atmospheric Research, 91, 188-193.
The I-LOR technique, developed specifically so that contributions from local and cultural noise are minimised when resonance parameters are extracted.
Nickolaenko, A. & Hayakawa, M. (2002). Resonances in the Earth-Ionosphere Cavity. Kluwer Academic Publishers.
Standard reference on cavity resonance structure, mode frequencies and propagation.
Schumann, W.O. (1952). Über die strahlungslosen Eigenschwingungen einer leitenden Kugel, die von einer Luftschicht und einer Ionosphärenhülle umgeben ist. Zeitschrift für Naturforschung A, 7(2), 149-154.
The original prediction of the cavity resonances that carry his name.
Content last reviewed:
Common Questions
Thunderstorm Interference FAQ
A reading you can trust
on the days it matters
The app runs this check every hour and tells you when a reading is held, with the raw sensor value one tap away. No fake spikes, no alarm on a day the antenna was measuring rain.
Explore More